

In this article, we will consider volatility in detail — one of the characteristics of the price of a financial asset. You will learn what volatility is, what this indicator indicates, and how to calculate it. The information will be useful to both novice investors and more experienced stock market participants.
What is volatility
Volatility is a parameter of price change. It is worth noting that volatility can be applied not only to financial assets. The concept closest in meaning to volatility is the concept of instability. Sometimes instability and volatility can be used interchangeably in the lexicon of people close to financial markets.
Let's explain volatility in simple words using an elementary example:
Day | Asset 1 | Asset 2 |
1 | 100 | 10 |
2 | 1 | 9 |
3 | 1000 | 8 |
4 | 231512 | 10 |
5 | 21843 | 11 |
6 | 69822226589 | 12 |
7 | 5 | 13 |
8 | 99854 | 14 |
9 | 0,9 | 15 |
You see Asset 1 and Asset 2, prices for both assets within 9 days are also indicated. As we can see, the prices of Asset 1 change more radically than the prices of Asset 2. That is, Asset 1 is more volatile than Asset 2.
Price change is what they mean when they talk about volatility. Market volatility indicates the strength of fluctuations of any asset — currency, securities. For example, with high volatility, price fluctuations are very noticeable. In fact, this means that you have a chance to earn more if you manage the risks, which are also increased. With low volatility, asset prices are more stable — there are fewer risks and profits, respectively, too.
In fact, the volatility indicator is the basis for all investment forecasts.
FC Daliz-Finance LLC has the ability to purchase military bonds on the secondary market, as well as the experience of purchasing military bonds through primary dealers. In the first months of the war, our clients bought military bonds worth more than 500 million hryvnias. Join their number by submitting an application on our website.
Market volatility: types
Volatility is relative and has no absolute, so there is no classification as such. At the same time, as a relative value, it is possible to compare the volatility of different assets or one asset in different time periods.
Stocks are usually more volatile than bonds and less volatile than options. But at the same time, a certain stock can have periods of higher volatility (price changes of 10% per day) and lower (price changes of no more than 1% per day).
The volatility indicator of the company's asset is affected by:
- size, reputation, age of the company;
- niche activity;
- internal and external force majeure situations;
- changes in the country's legislation, reforms.
Read also: How to start investing in Ukraine in 2023
How to calculate volatility: methods and examples
The basic calculation of asset volatility is the following formula:
standard declination * square root of time
Let's consider the calculation of the weekly volatility of an asset with a standard deviation of 8:
8* √7 = 21,166
As you can see, the formula itself is very simple, but the complexity arises in the methodology of calculating the standard deviation parameter. In this case, 2 approaches are used to calculate the standard deviation, and as a result, volatility:
- Historical.
- Prognostic.
Accordingly, with the historical approach, the standard deviation is calculated on the basis of already existing data using the formula:
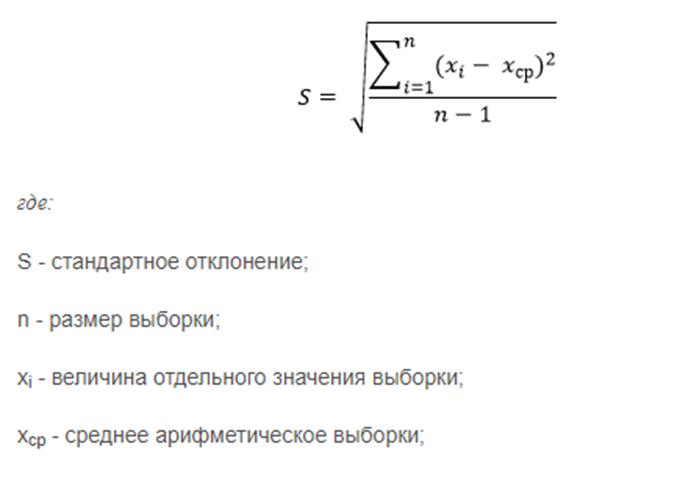
The predictive approach is more complicated and uses different methods to calculate the predictive values of the standard deviation in the future.
Volatility indicators: what are there
Investors use different indicators to assess and forecast volatility. There are several such indicators and, as a rule, they are chosen according to the trading strategy. Most often, investors use:
- Bollinger Bands (bollinger lines);
- Standard Deviation;
- Average True Range (ATR).
Read also: Types of transactions on the stock exchange: a guide for investors
Frequently asked questions: what is market volatility
What is volatility measured in
Volatility as a statistical parameter is measured in numbers.
How does volatility differ from liquidity
Volatility is an indicator of fluctuating prices on the market of a specific asset. Liquidity is the activity of the financial asset market, a concept that allows you to understand how quickly and easily you can sell/buy an asset.
Accordingly, the asset can be:
- liquid and volatile;
- volatile and illiquid;
- liquid and non-volatile;
- illiquid and non-volatile.


